Jan 2026 – Mar 2026
LSTM vs. ResNet for Market Direction
Stock prices are usually treated as a time series, but traders read them as chart patterns. We tested whether a vision model on chart images could match a sequence model on the same data.
- My role
- Built, trained, and analyzed the models on a three-person team
- Stack
- Python, PyTorch
The setup
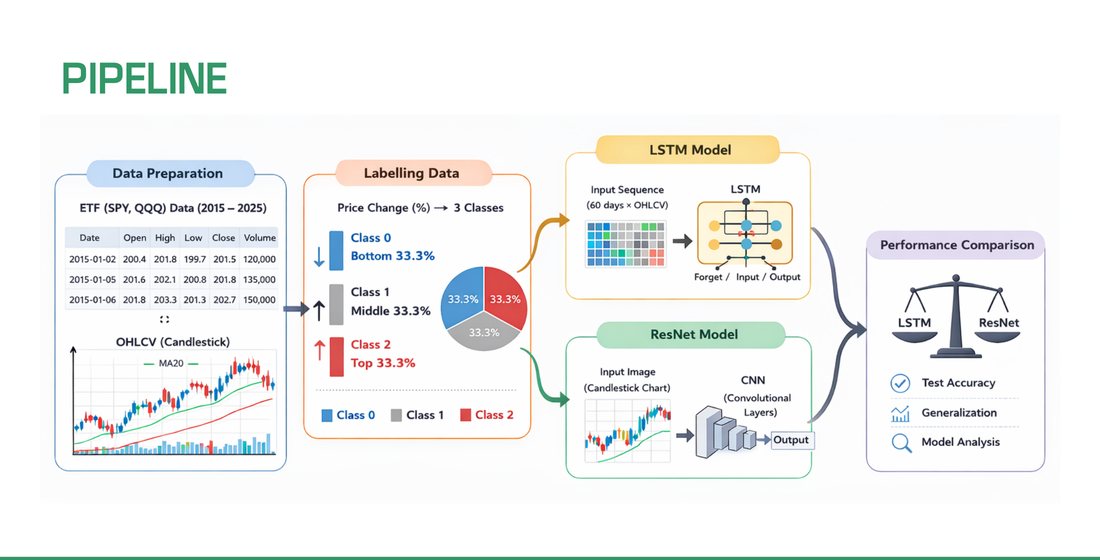
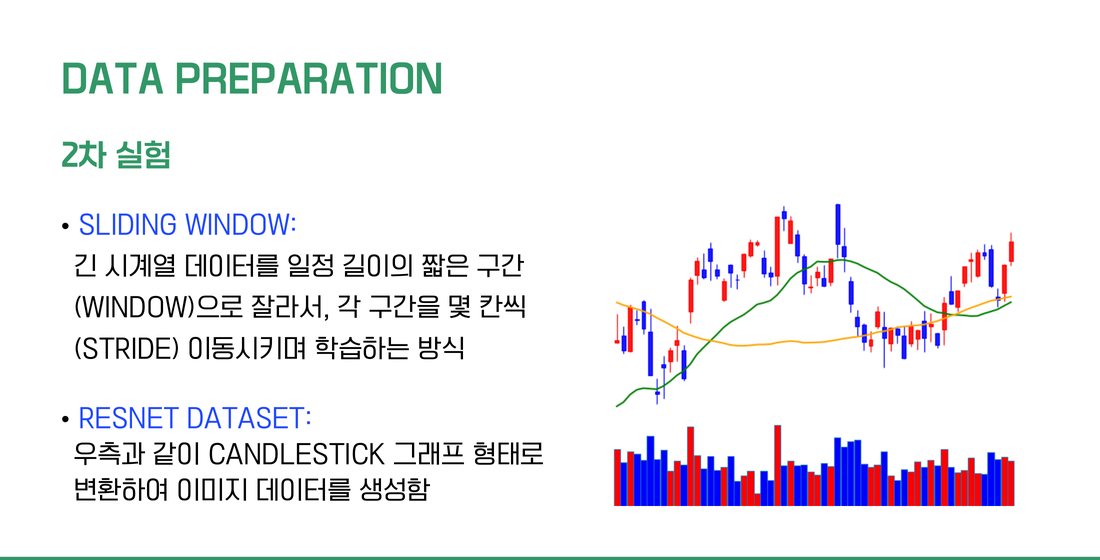
This was a toy project by a three-person team in the YAI 17th cohort, presented in March 2026. I built and trained the models and analyzed the results. Both models received the same market windows: LSTM as numeric sequences, ResNet as candlestick images.
Redesigning the experiment
The first attempt used five years of NVIDIA data with five return classes. In later epochs the models stopped finding patterns and predicted the most common class, so the results meant little.
For the second attempt we changed the data and the labels: ten years of SPY and QQQ (2015 to 2025), eight for training and two for testing, 60-day windows with OHLCV and moving averages, and three equal classes for down, flat, and up.
Results
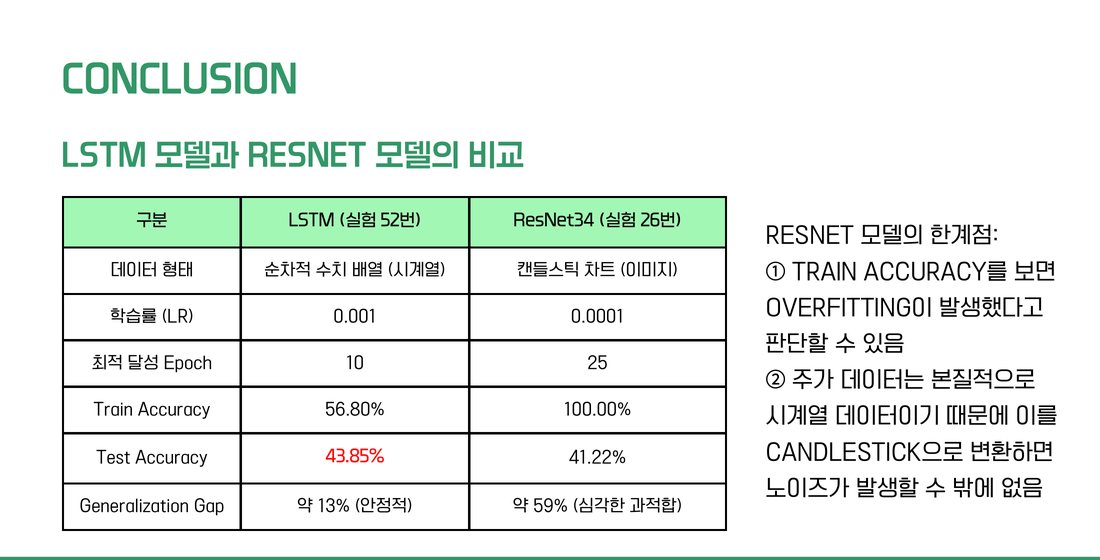
Best observed test accuracy was 43.85% for LSTM and 41.22% for ResNet34, against 33.3% for chance. ResNet reached 100% training accuracy, a clear sign of overfitting, while LSTM stayed at 56.80%. These figures come from the epochs with the best test score, so they should be read as an upper bound, not as a working predictor.
What I would change
- Price and volume alone miss macro factors, news, and sentiment.
- Time and compute limited the size of the dataset and the range of the tuning.
- A next step would be a multi-modal model that combines the sequence and chart views, with news added through NLP.